|
RISC-V VHDL: System-on-Chip
2.0
|


|
|
RISC-V VHDL: System-on-Chip
2.0
|
|
riscv_soc repository. The main purpose was to provide convinient way to develop and debug our Satellite Navigation firmware that can not be debugged by any other tool provided RISC-V community. Additionally, we would like to use the single unified application capable to work with Real and Simulated platforms without any modification of source code. Debugger provides base functionality such as: run control, read/write memory, registers and CSRs, breakpoints. It allows to reload FW image and reset target. Also we are developing own version of the CPU simulator (analog of spike) that can be extended with peripheries models to Full SOC simulator. These extensions for the debugger simplify porting procedure of the Operating System (Zephyr project) so that simulation doesn't require any hardware and allow develop SW simultaneously with HW developing.General idea of the project is to develop one Core library providing API methods for registering classes, services, attributes and methods to interact with them. Each extension plugin registers one or several class services performing some usefull work. All plugins are built as an independent libraries that are opening by Core library at initialization stage with the call of method plugin_init(). All Core API methods start with RISCV_... prefix:
Configuration of the debugger and plugins is fully described in JSON formatted configuration files targets/target_name.json. These files store all instantiated services names, attributes values and interconnect among plugins. This configuration can be saved to/load from file at any time. By default command exit will save current debugger state into file (including full command history).
api_core.h.UART, GPIO, SRAM, ROMs and etc.We provide several targets that can run your software (bootloader, firmware or user application) without source code modifications:
| Start Configuration | Description |
|---|---|
| $ ./_run_functional_sim.sh[bat] | Functional RISC-V Full System Model |
| $ ./_run_systemc_sim.sh[bat] | Use SystemC Precise Model of RIVER CPU |
| $ ./_run_fpga_gui.sh[bat] | FPGA board. Default port 'COM3', TAP IP = 192.168.0.51 |
To run debugger with real FPGA target connected via Ethernet do:
*     # cd rocket_soc/debugger/win32build/debug
*     # _run_functional_sim.bat
*
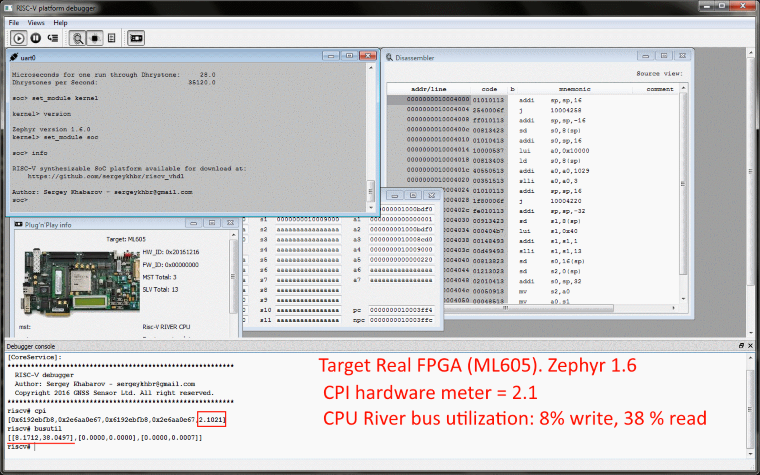
The result should look like on the picture below:
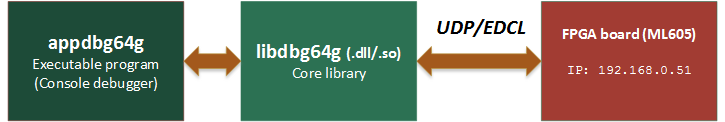
Core library uses UDP protocol to communicate with all targets: FPGA or simulators. The general structure is looking like on the following figure:
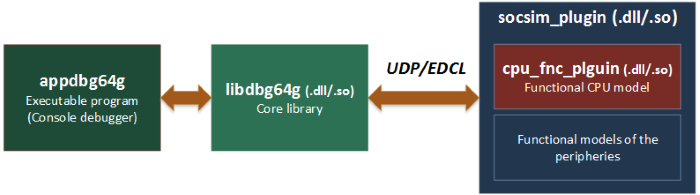
or with real Hardware
If you'll get the error messages that image files not found
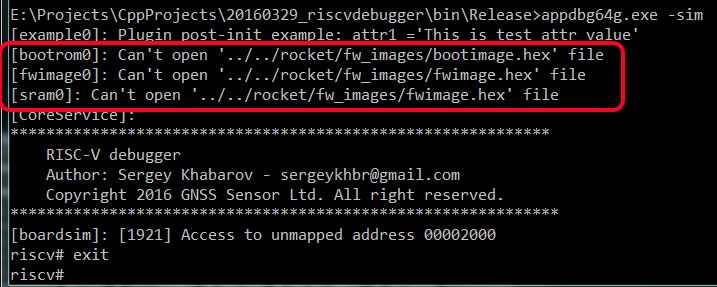
To fix this problem do the following steps:
exit command.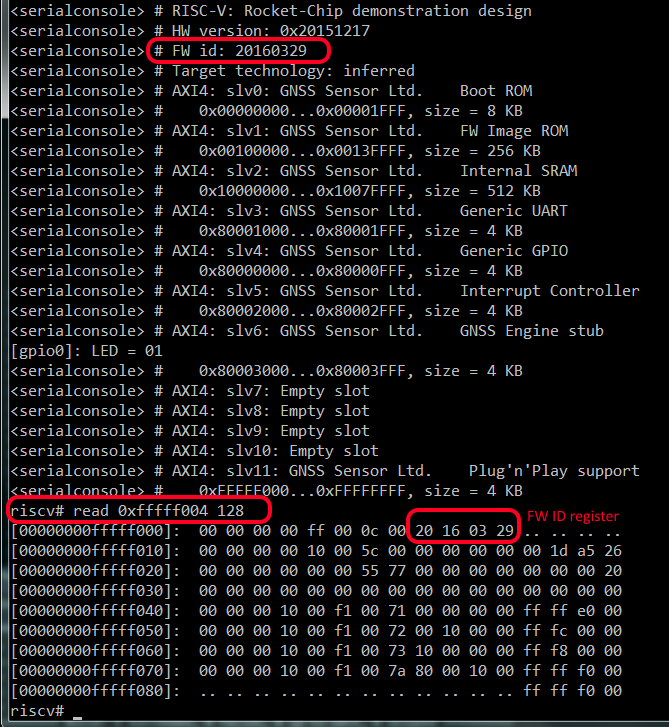
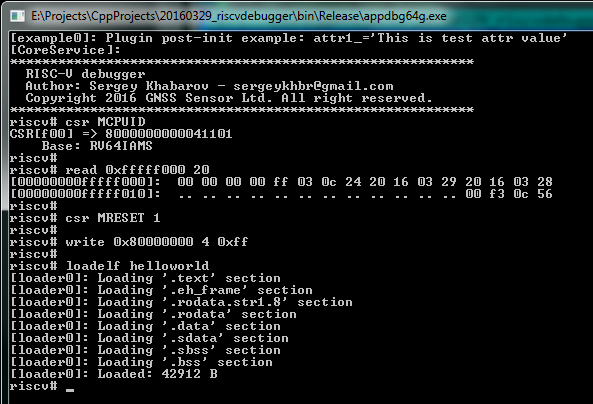
Debug your target. All commands that are available for Real Hardware absolutely valid for the Simulation. Debugger doesn't see any difference between these two targets.
ttyUSB0).This erros means that host cannot locate board with specified IP address. Before you continue pass through the following checklist:
Example of debugging session (Switch ON all User LEDs on board):
Debugger console view
 1.8.13